Explore listed
stocks in India
Clean charts. Real fundamentals. Instant execution.
Everything you need, nothing you don't.
₹0 Equity Delivery. ₹0 AMC. SEBI Registered.
Stocks insights
Marketwatch
Gainers
Gainers
Losers
Losers
52 Week High
52 Week High
52 Week Low
52 Week Low
Name | CMP |
|---|---|
Acutaas Chemicals Ltd. | 1,467.5 46.1 (3.24%) |
Approaching High/Low
Filter :
52 Week High
52 Week High
52 Week Low
52 Week Low
Name | CMP | 52WH | % Away |
|---|---|---|---|
Grasim Industries Ltd. | 3,095.5 -102.00 (-3.19%) | 3,197.5 | 3.19% |
Sona BLW Precision Forgings Ltd. | 601.85 -19.95 (-3.21%) | 621.8 | 3.21% |
Solar Industries India Ltd. | 18,267.00 -607.00 (-3.22%) | 18,874.00 | 3.22% |
JB Chemicals & Pharmaceuticals Ltd. | 2,210.2 -75.1 (-3.29%) | 2,285.3 | 3.29% |
Ather Energy Ltd. | 1,032.8 -36.2 (-3.39%) | 1,069.00 | 3.39% |
Advanced charting.
Integrated execution.
Trade directly from the chart. Switch seamlessly between native line, candlestick, or integrated TradingView charts. Your execution engine sits right alongside your analysis.
- 1
Integrated SL/TP
- 2
Advanced Option chain
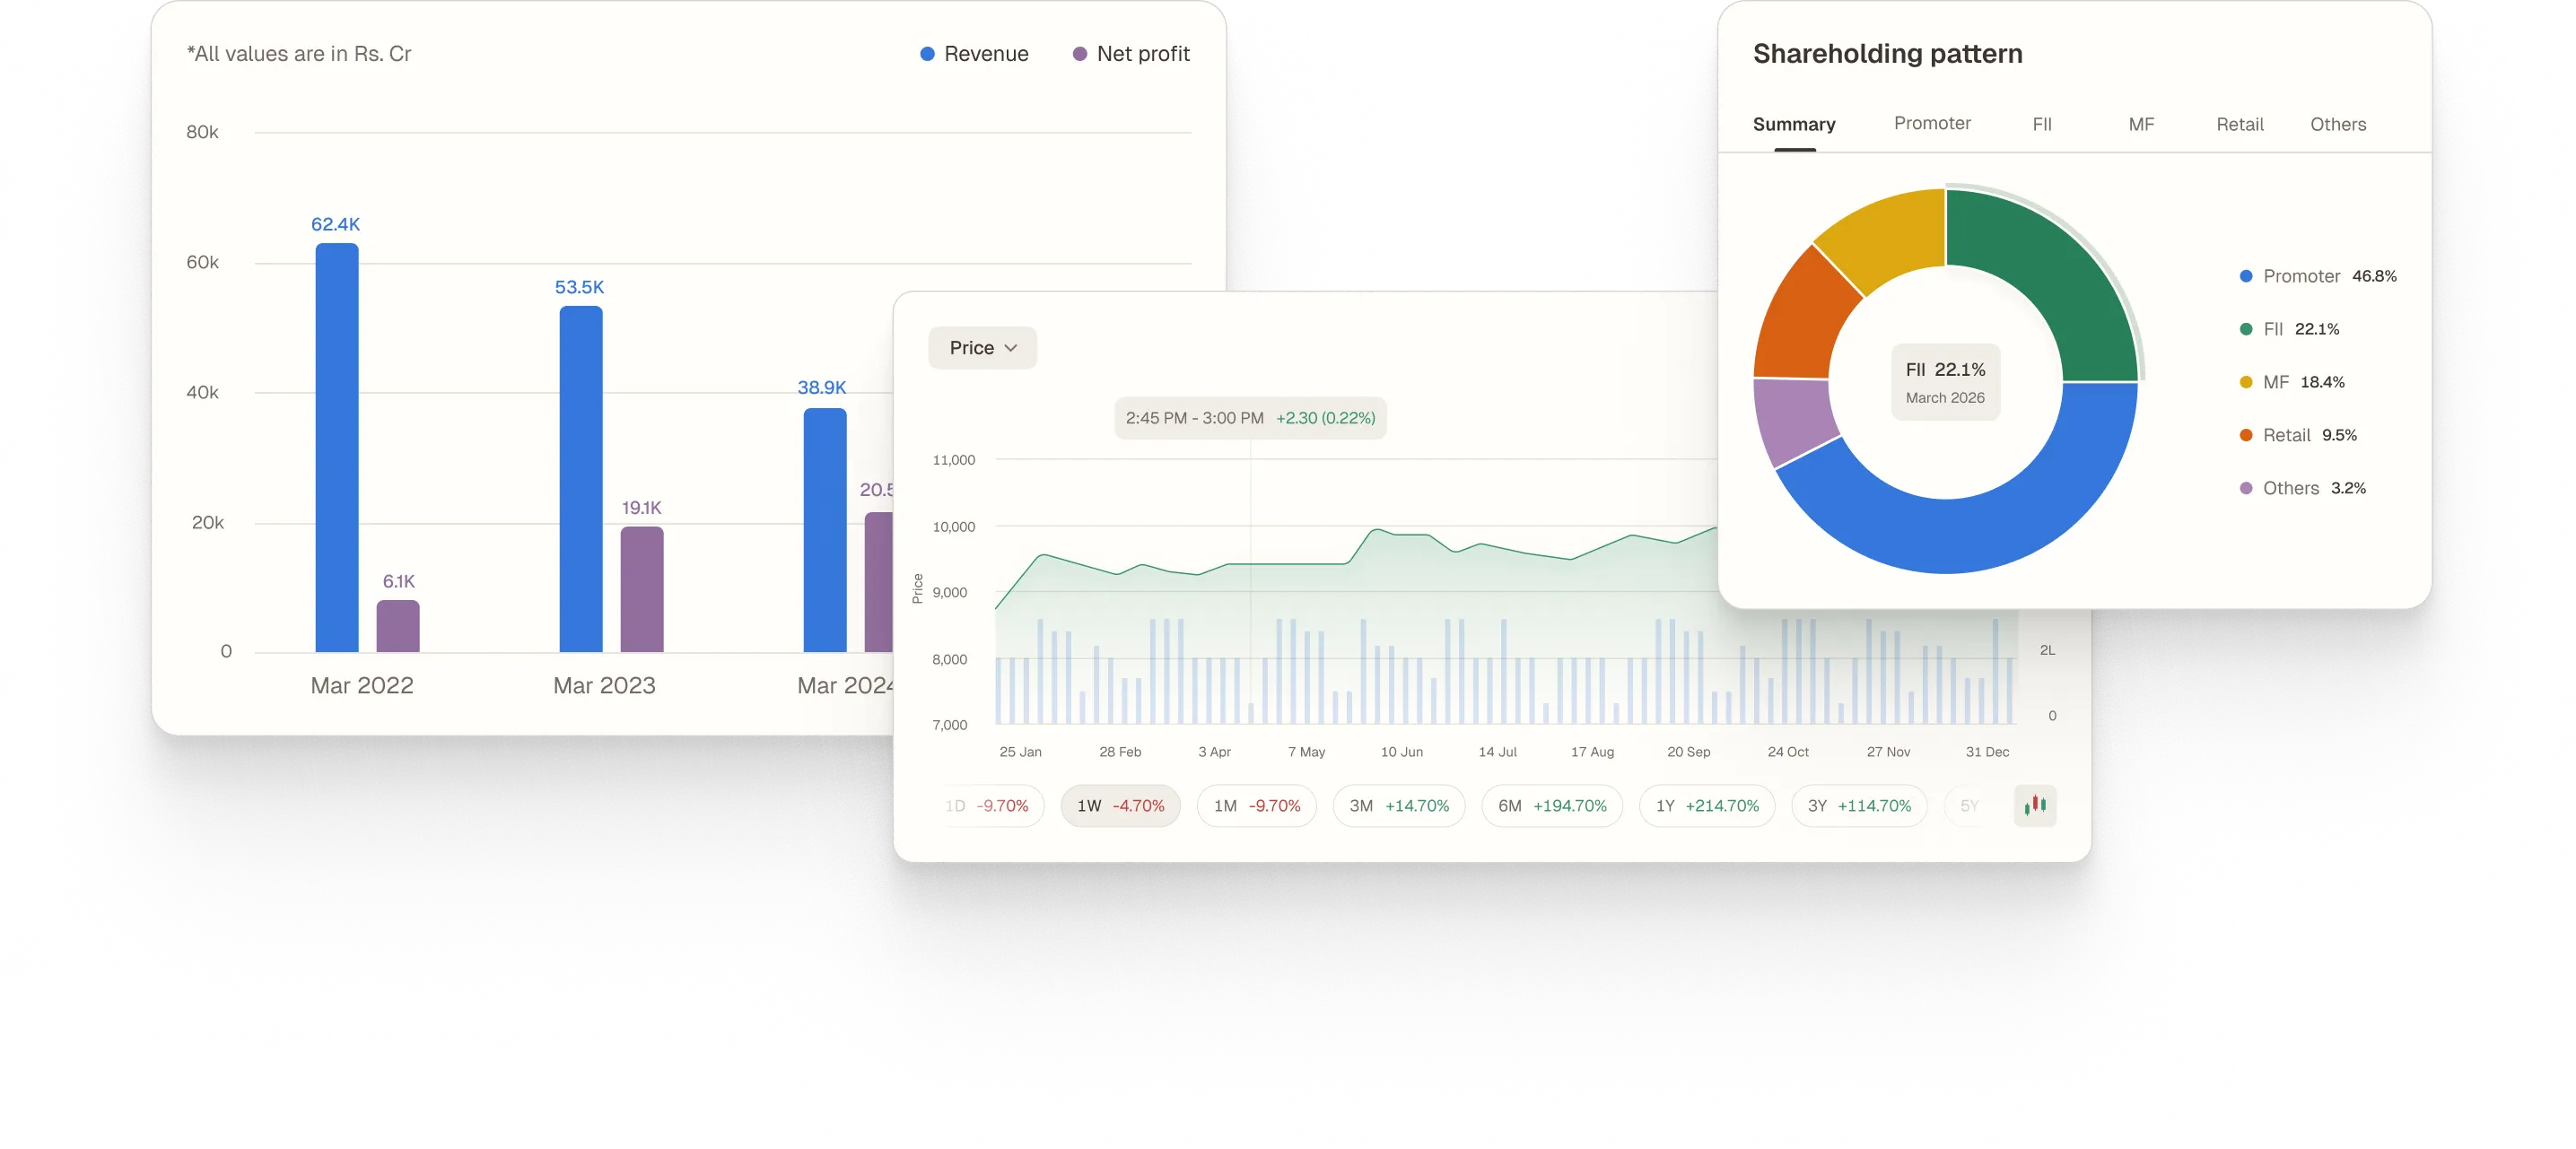
Deep fundamentals.
Zero clutter.
We don't just show the price. Access years of pure, institutional-grade financial data structured for investors who look deeper than the surface.
- 1
Comprehensive financials: Glance through or deep dive into granular line items. Analyze P&L, balance sheets, and cash flows to the exact level of detail you need.
- 2
Key ratios: Track essential metrics like PE, PB, ROE, ROCE, and Debt-to-Equity. Deep dive into valuation, profitability, and other core ratios for quick analysis.
- 3
Shareholding & peers: Monitor top stakeholders at a glance. See exact ownership breakdowns across promoters, public, and institutions, alongside direct competitor metrics.
Stock market listed companies
FILTERS:
Index
Sector
Market Cap
PE Ratio
See More
Index
NIFTY
Name | Sector | MarketCap (Cr) | Price | 1D Returns | 1W Returns | 1M Returns | 3M Returns | 6M Returns | 1Y Returns | 3Y Returns | 5Y Returns |
|---|---|---|---|---|---|---|---|---|---|---|---|
Crude Oil | 17,18,091.12 | 1,269.20 | 0% | -3.48% | -10.62% | -11.28% | -17.26% | -12.47% | 2.54% | 15.73% | |
Bank | 11,36,962.41 | 738.35 | 0% | -0.82% | -4.35% | -13.14% | -25.98% | -62.76% | -54.21% | -50.18% | |
Telecom | 10,95,710.91 | 1,799.00 | 0% | -1.69% | -0.83% | -4.35% | -13.18% | -3.62% | 115.49% | 236.11% | |
Bank | 9,25,692.48 | 1,002.70 | 0% | 5.13% | -0.43% | -9.76% | 4.44% | 22.13% | 72.88% | 135.98% | |
Bank | 9,14,715.69 | 1,275.00 | 0% | 4.52% | 1.24% | -0.98% | -7.47% | -11.40% | 35.93% | 100.65% | |
IT | 7,77,726.00 | 2,151.00 | 0% | -10.11% | -9.28% | -15.35% | -33.30% | -37.47% | -33.09% | -32.99% | |
Finance | 5,52,117.63 | 886.90 | 0% | 0.56% | -6.25% | -6.64% | -12.71% | -8.38% | -8.38% | -8.38% | |
Infrastructure | 5,36,603.17 | 3,900.60 | 0% | -2.51% | -1.20% | -0.90% | -2.48% | 5.31% | 64.93% | 155.78% | |
FMCG | 5,01,167.82 | 2,132.80 | 0% | 1.95% | -6.34% | -4.10% | -7.53% | -10.89% | -19.36% | -9.78% | |
IT | 4,78,938.77 | 1,180.30 | 0% | -4.98% | 0.37% | -10.58% | -26.60% | -25.49% | -7.32% | -17.11% | |
Healthcare | 4,26,937.66 | 1,779.00 | 0% | -0.11% | -2.64% | -1.71% | -0.50% | 4.54% | 80.08% | 164.32% | |
Logistics | 4,20,725.97 | 1,826.40 | 0% | -0.16% | 3.94% | 25.96% | 21.76% | 24.08% | 148.42% | 112.73% | |
Automobile & Ancillaries | 4,12,458.45 | 13,120.00 | 0% | 0.81% | -2.05% | -4.38% | -18.46% | 3.63% | 36.31% | 80.77% | |
Bank | 4,02,005.87 | 1,292.40 | 0% | 3.80% | 2.68% | -0.22% | 1.52% | 5.55% | 32.83% | 74.78% | |
Trading | 3,87,676.86 | 2,979.90 | 0% | 0.67% | 19.43% | 46.79% | 32.10% | 14.61% | 21.13% | 84.86% | |
Bank | 3,79,707.98 | 381.70 | 0% | 1.09% | 1.49% | -2.25% | -82.08% | -82.22% | -79.64% | -78.65% | |
Automobile & Ancillaries | 3,71,983.00 | 2,990.10 | 0% | -0.20% | -7.57% | -8.78% | -18.30% | -3.61% | 117.00% | 270.06% | |
Diamond & Jewellery | 3,64,378.51 | 4,104.90 | 0% | 1.18% | -5.64% | -1.68% | 7.15% | 15.79% | 42.29% | 135.72% | |
FMCG | 3,50,950.41 | 280.00 | 0% | -0.83% | -8.79% | -9.39% | -30.19% | -34.04% | -36.36% | 34.16% | |
Power | 3,44,861.93 | 355.65 | 0% | -3.37% | -11.51% | -7.62% | 11.19% | 4.97% | 94.56% | 197.99% | |
Crude Oil | 3,25,955.03 | 259.00 | 0% | -2.32% | -7.73% | -4.38% | 8.22% | 6.04% | 67.26% | 109.29% | |
Construction Materials | 3,21,511.18 | 10,911.00 | 0% | -2.41% | -7.54% | -5.99% | -4.50% | -4.37% | 33.71% | 61.69% | |
IT | 3,10,986.02 | 1,146.30 | 0% | -6.71% | -4.23% | -15.78% | -31.08% | -30.67% | 3.00% | 17.03% | |
Iron & Steel | 3,08,347.29 | 1,261.70 | 0% | -4.05% | -1.12% | 5.48% | 14.56% | 24.31% | 67.20% | 79.91% | |
Capital Goods | 3,01,199.44 | 412.05 | 0% | 0.99% | -5.92% | -11.39% | 5.65% | 3.92% | 240.68% | 718.86% | |
Mining | 2,87,706.97 | 466.90 | 0% | -1.06% | 2.39% | 4.97% | 23.36% | 15.86% | 104.56% | 197.20% | |
Automobile & Ancillaries | 2,84,720.26 | 10,184.00 | 0% | -0.94% | -3.92% | 7.77% | 13.65% | 17.80% | 114.40% | 140.81% | |
FMCG | 2,71,969.45 | 1,410.40 | 0% | 0.38% | -4.40% | 14.03% | 16.01% | -41.61% | -36.04% | -19.52% | |
Finance | 2,70,869.08 | 1,693.10 | 0% | -2.64% | -6.16% | -8.24% | -18.21% | -16.27% | 14.94% | 46.58% | |
Power | 2,65,718.25 | 285.70 | 0% | 1.31% | -9.00% | -4.18% | 7.85% | -4.94% | 55.48% | 104.80% |
Discover your earning potential
Frequently asked questions
What are listed stocks in India?
Listed stocks in India are shares of companies that are traded publicly on stock exchanges like the BSE (Bombay Stock Exchange) and NSE (National Stock Exchange). These companies have met specific rules and regulations set by authorities like SEBI (Securities and Exchange Board of India) to make their shares available for people to buy and sell in the stock market.
How many stocks are currently listed in India?
In India, around 5,500 companies are listed on the Bombay Stock Exchange (BSE), and about 2,400 companies are listed on the National Stock Exchange (NSE). Some of these companies are listed on both exchanges.
How can I start investing in listed stocks in India?
To invest in Indian stocks, you'll need to open a demat account through a trading platform and complete the Know Your Customer (KYC) process. This setup allows you to buy and sell shares seamlessly. Capmint is planning to launch an app soon, aiming to provide users with an easy way to trade stocks and access various tools and data. You can join the waitlist today to be among the first to try our platform.
What are the benefits of investing in stocks listed on Indian exchanges?
Investing in stocks listed on Indian exchanges offers potential long-term wealth growth, ownership in companies, easy liquidity, dividend income, and transparency due to strict regulatory standards for listed companies.
How can I check the performance of listed stocks in India?
You can check the performance of listed stocks in India on the official websites of BSE (Bombay Stock Exchange) and NSE (National Stock Exchange). These platforms provide detailed stock prices, charts, and other data. Users can also use Capmint, which makes it easier to analyze stock performance with tools and filters tailored to your needs.
What is the difference between listed and unlisted stocks in India?
Listed stocks are shares of companies that trade on stock exchanges like BSE and NSE, following strict rules and regulations. Unlisted stocks are shares of companies not traded on these exchanges and are usually bought and sold privately.
Scan to download
CapMint app

Engineered for the obsessed. Built for traders.

Purpose-built terminals.
Zero compromise.
Built for speed.
Plot No 1290, 2nd Floor, 17th Cross, 5th Main, Sector-7, HSR Layout, Bangalore 560102
Follow us on
Mintcap Brokers Private Limited
CIN – U66110KA2023PTC178706 | Registered Address: Plot No 1290, Second Floor, 17th Cross, 5th Main, Sector-7, HSR Layout, Bangalore 560102 | Tel: 080 – 49552310 | Email ID: compliance@capmint.com | SEBI registered Stock Broker: INZ000322732 | NSE Cash/F&O Member ID: 90430 | BSE Cash/F&O Member ID: 6903 | MCX Member ID: 57400 | NCDEX Member ID: 1312 | SEBI registered Depository Participant: IN-DP-806-2025 | CDSL DP ID: 12102300 | NSE Clearing Member code: M70108 | AMFI-Registered Mutual Fund Distributor: ARN-289109 (Valid upto 28-Feb-2027) | Category II Execution Only Platform : E6903
Details of Client Bank Account
Compliance Officer: Ms. Shridevi Vungarala | Email ID: compliance@capmint.com | Tel no. + 91 9035330126 | Grievance Redressal Officer (GRO) – Ms. Shikha Gupta | Email ID: Grievance@capmint.com | Tel no: 9035331595.
Procedure to file a complaint on SEBI SCORES: Register on SCORES portal. Mandatory details for filing complaints on SCORES: Name, PAN, Address, Mobile Number, E-mail ID. Benefits: Effective Communication, Speedy redressal of the grievances. You may refer the website https://scores.sebi.gov.in/ for more information. You may also download the SEBI Scores app to log a complaint Android: https://play.google.com > store > apps > sebiscores iOS: https://apps.apple.com > app > sebiscores
Disclaimer
Investment in the securities market are subject to market risks, read all the related documents carefully before investing. Brokerage will not exceed the SEBI prescribed limit.
Mutual fund investments are subject to market risks, read all scheme related documents carefully before investing. Mutual Funds are not exchange-traded products.
Attention Investor:
- Stock Brokers can accept securities as margin from clients only by way of pledge in the depository system w.e.f. September 1, 2020.
- Update your mobile number & email Id with your stock broker/depository participant and receive OTP directly from depository on your email id and/or mobile number to create pledge.
- Pay 20% as upfront margin of the transaction value to trade in cash market segment.
- Investors may please refer to the Exchange’s Frequently Asked Questions (FAQs) issued vide circular reference NSE/INSP/45191 dated July 31, 2020 and NSE/INSP/45534 dated August 31, 2020 and other guidelines issued from time to time in this regard.
- Check your Securities /MF/ Bonds in the consolidated account statement issued by NSDL/CDSL every month.